

Business finance refers to the funds you need to set up and run your small business, especially in the early stages. Your finance business options can come in many forms.
However, business finance isn’t exclusive to funds at the start-up stage. It also refers to the finances you’ll need to grow your small business or for large business purchases, such as equipment, stock or real estate.
Business Finance Manager
The best way to artfully manage the process of acquiring and deploying business finances is with a business finance manager on your team. A business finance manager works toward maximising profit, limiting expenses, and safeguarding the financial future of a business.
The role of a business finance manager need not be internal for smaller businesses. The business management and finance expert can be short-term consultants or business advisors, or perhaps the role may be the business owner themselves.
The role of a business finance manager entails:
- Advising on the most suitable forms of business finances.
- Reporting on expected cash flow and financial trends.
- Analysing competitors and market shifts.
- Evaluating a business’s current financial position.
- Advising a business on the best financial courses of action, according to the data.
- Creating reports around budgets, account payables and account receivables.
- Devising long-term business strategies and business plan.
- Minimising financial risk and maximising the potential for financial gain.
- Maximising cash flow and profit.
- Limiting expense.
Methods of financing a business
There are many methods of financing a business and they all come with caveats, shortcomings and, of course, benefits. Before you commit to a source of business finance, take a moment to look over your options and weigh them against your circumstances.
There are three primary types of business finances:
- Internal funding
- Debt finance
- Equity finance
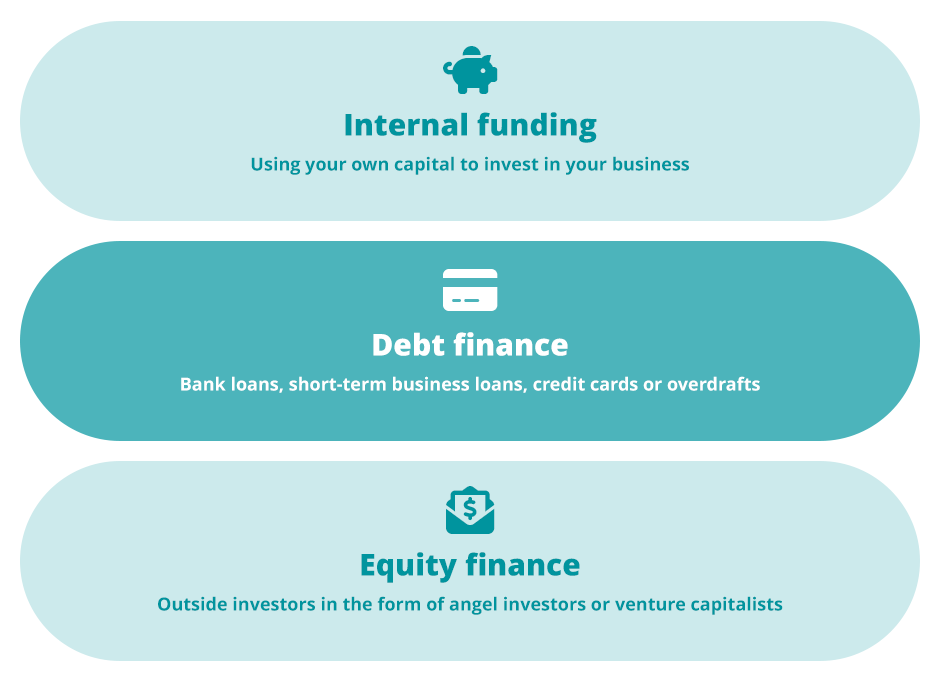
Internal funding
Internal funding refers to the act of using your own capital to invest in your business. By literally using your own cash and savings as your form of business finance, you’re free from the encumbrances of debt and interest. You also retain complete control over the activity and direction of your business.
However, you’re also jeopardising your business’s cash flow when your expenses are due. Furthermore, it may inhibit you from taking advantage of opportunities for growth, which would have relied on that capital.
Debt finance
Another major and popular form of business finance is debt finance, which refers to loans taken on as debt. Debt finance can be either bank loans, short-term business loans, credit cards or overdrafts.
This type of business finance is advantageous in that you still have control over your business activity and don’t need a deep pool of savings to invest and grow.
However, taking on debt and being bound to interest payments can expose an unstable business to risk and saddle it with the obvious burden of debt. You may also find it difficult to attain a loan without a loan history or assets as security.
Equity finance
Equity finance is the third type of business finance available, and it involves courting outside investors in the form of angel investors or venture capitalists.
This type of business finance is perhaps safer than debt financing as you don’t exactly owe any money, however, you’ll then lose a certain amount of control over your business trajectory and affairs.
Investors seek part ownership and part control over something they see turning a profit, which not only affects your control, it also means it may be difficult to find the right investors willing to grant funding.
Understanding the three primary methods of financing a business combined with consulting a business finance manager are the main considerations you’ll have when approaching the topic of business financing.